One of the reasons I made this blog in the first place was to discuss issues having to do with my business -- what decisions I've made, what has worked, what hasn't worked, and what I've learned. To help do that I'm going to lay out the financial basis of Æ Designs. Nobody I've seen so far in this little cottage industry has actually gone their financial details, that I've seen, and I hope that actually seeing the numbers for sales and seeing the costs of such things as tier payments and vendor rentals will prove interesting and useful to others.
In late May, when my sales started to increase to the point that they were paying for SL, I started tracking my business' sales in detail. Generally I do this at work (shh!) and so I used my old friend, Microsoft Excel. What I do is pretty simple. I take the information from the SL website's transaction history at
http://secondlife.com/account/transactions.php:

...and I simply copy and paste that over into a spreadsheet I've designed:
Notice that I have little formulas that calculate the day of the week and the rough time of day of the sale, because I run reports using those criteria later on. I also make note of the product in a consistant fashion: "CP" stands for "Clothespins", "THC" is the "Tiny Hanging Cell", and "CBK" is the "Cubical Barred Kennel". Depending on how the product got sold I might have this data on hand or I might have to look at my vendor reports to get it (more on that later, too). Note too that my stipend (L$400, woo) doesn't get put into the spreadsheet because it's not business-related. When I first got the JEVN system I use I thought it would be convenient to get all my sales data through the JEVN email reporting system but, as we will see down the road, this is really too clunky and unreliable to make much sense of.
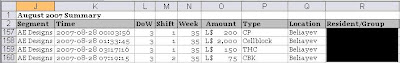
So I pretty much do that every day. During the month I add all these little sales together and I come up with monthly sales figures that I break down in a few ways. So here are some of the actual figures for Æ Designs in the month of August to date:
 At the top I collect most of the higher-level stuff for the month, like the total revenue in the month, the average revenue per day in the month, the profit per day, and the amount of time left in the month. I can calculate how many sales I can expect for the rest of the month, and I can give some rough estimates of how much real money I could sell those linden for.
In the lower section I break it down by location. Beliayev is the site of my home store and by far and away my best location -- a point we'll return to soon. The other sites are mostly vendors that I've placed, either in a friend's business (the Matriarch vendor is in *SSC*), or in a mall (Meriland is Liz's Fetish Mall, Halfway is the Bondage Playground sales area). I use the "SLX" location to show sales I made on http://www.slexchange.com/. Down at the bottom, in very dim grey, we see some entries for vendors that don't exist anymore. Note that I also list expenses that are associated with each location, so that I can get some idea of the profitability of vendors that I'm renting space for. Since I paid ahead a little bit for some of these vendors they aren't showing any expenses this month, so let's look instead at the overall figures (not just August) and see if there are any problems I should address:
At the top I collect most of the higher-level stuff for the month, like the total revenue in the month, the average revenue per day in the month, the profit per day, and the amount of time left in the month. I can calculate how many sales I can expect for the rest of the month, and I can give some rough estimates of how much real money I could sell those linden for.
In the lower section I break it down by location. Beliayev is the site of my home store and by far and away my best location -- a point we'll return to soon. The other sites are mostly vendors that I've placed, either in a friend's business (the Matriarch vendor is in *SSC*), or in a mall (Meriland is Liz's Fetish Mall, Halfway is the Bondage Playground sales area). I use the "SLX" location to show sales I made on http://www.slexchange.com/. Down at the bottom, in very dim grey, we see some entries for vendors that don't exist anymore. Note that I also list expenses that are associated with each location, so that I can get some idea of the profitability of vendors that I'm renting space for. Since I paid ahead a little bit for some of these vendors they aren't showing any expenses this month, so let's look instead at the overall figures (not just August) and see if there are any problems I should address:
 Now we have some context and we can look at how profitable all those little vendors actually are. One thing that leaps out is that they collectively only account for 30% of my revenue: the main store is by far my most important location. This is a great lesson for those who are just starting out and who maybe just have a couple vendors out there -- it's well-worth it to have that main location, even if it's just a tiny little place. Another lesson is that many of these vendors are very marginal sellers. Look at the one on Sarah's Island, for instance. I've had that vendor out there for about four months, and in all that time it's only been good for L$2,050 in sales, compared with a cost of L$1,600 to keep the vendor going. The vendor on Brandy's Island is even worse: L$1,200 each way, so it's just breaking even. We can dimly see down below in the dead vendor area why those vendors are dead; the one in Bacchus (an experiment in a mall that I will discuss later) was a clear loser, costing L$1,200 to generate only L$400 in sales in a month, before I shut it down.
My philosphy has always been that the advertising value of these vendors is both small and measurable, and that in general unprofitable vendors should be thrown away. It's a theme that will come up again and again -- vendors that are sitting around in big malls with a ton of other vendors, waiting for someone to walk by and purchase something, are just not very valuable, as advertising or otherwise. Next to every vendor I put a little sign that says:
Now we have some context and we can look at how profitable all those little vendors actually are. One thing that leaps out is that they collectively only account for 30% of my revenue: the main store is by far my most important location. This is a great lesson for those who are just starting out and who maybe just have a couple vendors out there -- it's well-worth it to have that main location, even if it's just a tiny little place. Another lesson is that many of these vendors are very marginal sellers. Look at the one on Sarah's Island, for instance. I've had that vendor out there for about four months, and in all that time it's only been good for L$2,050 in sales, compared with a cost of L$1,600 to keep the vendor going. The vendor on Brandy's Island is even worse: L$1,200 each way, so it's just breaking even. We can dimly see down below in the dead vendor area why those vendors are dead; the one in Bacchus (an experiment in a mall that I will discuss later) was a clear loser, costing L$1,200 to generate only L$400 in sales in a month, before I shut it down.
My philosphy has always been that the advertising value of these vendors is both small and measurable, and that in general unprofitable vendors should be thrown away. It's a theme that will come up again and again -- vendors that are sitting around in big malls with a ton of other vendors, waiting for someone to walk by and purchase something, are just not very valuable, as advertising or otherwise. Next to every vendor I put a little sign that says:
 If you click it you get a landmark, obviously, but not so obvious is that I have the script that gives the landmark inform me via IM that it has done so:
AE Designs Landmark Giver: 2007-08-25 11:33:38 -> LM Giver @ Matriarch <172.59247,> gave landmark to xxxxx xxxxxxxx.
Since all my landmark givers let me know when they hand out LMs, and to who, I can figure out in a rough way how good a spot is for advertising, and actually I can connect those landmark handouts to sales later on and see how much real revenue is generated as a result of those LMs. Having all this data makes it a lot easier to make decisions, I think, because I don't have to do any guesswork. For example, I should really be making a decision on whether it's worthwhile to keep that Brandy's Island vendor around. I go back to my logs and I find that in two months of having the vendor, I've handed out 10 landmarks, and exactly one of those people has gone on to buy something. That's not too good! I'm hardly getting any traffic, and the traffic I do get is either not interested in my products or too poor to afford them. Brandy's Island is obviously right at the edge of profitability -- I'll give it maybe another month since it's not actually costing me money, and since the rent is only L$75 a week, but if the sales don't improve it probably doesn't make much sense to keep it around.
Collecting all this data lets me make some graphs, too, so I can get kind of a visual of what's going on. For example, there's the overall monthly profit & loss graph:
If you click it you get a landmark, obviously, but not so obvious is that I have the script that gives the landmark inform me via IM that it has done so:
AE Designs Landmark Giver: 2007-08-25 11:33:38 -> LM Giver @ Matriarch <172.59247,> gave landmark to xxxxx xxxxxxxx.
Since all my landmark givers let me know when they hand out LMs, and to who, I can figure out in a rough way how good a spot is for advertising, and actually I can connect those landmark handouts to sales later on and see how much real revenue is generated as a result of those LMs. Having all this data makes it a lot easier to make decisions, I think, because I don't have to do any guesswork. For example, I should really be making a decision on whether it's worthwhile to keep that Brandy's Island vendor around. I go back to my logs and I find that in two months of having the vendor, I've handed out 10 landmarks, and exactly one of those people has gone on to buy something. That's not too good! I'm hardly getting any traffic, and the traffic I do get is either not interested in my products or too poor to afford them. Brandy's Island is obviously right at the edge of profitability -- I'll give it maybe another month since it's not actually costing me money, and since the rent is only L$75 a week, but if the sales don't improve it probably doesn't make much sense to keep it around.
Collecting all this data lets me make some graphs, too, so I can get kind of a visual of what's going on. For example, there's the overall monthly profit & loss graph:
 For the moment, anyway, prospects seem good for the business. I've got a sustained sales growth of about 35-40% per month so far, although that can't keep up forever. The costs have stayed pretty level, although those costs don't take into account land purchases, which I instead record on my balance sheet. Land, when purchased, becomes an asset you can sell later, so it's not appropriate or useful to just record the whole cost of it as a giant expense. Tier fees, which are ongoing and that don't count in any way as an asset, I do of course record. If I want a little finer detail I can look week-by-week:
 In this one I split it up by the line of products. "F" is for furniture, which means cages and stuff like that, and that's in black on the bottom. "A" is for attachments -- the bells and the clothespins -- and that's in dark grey in the middle. "P" means prefabs, which is to say dungeons, and that's in light grey on top. This graph gives you a pretty good idea of my whole business. Most of my revenue comes from the dungeons, but that income is a little feast-or-famine. To even things out a tad I have some other toys, which gives me a little revenue in good times and bad, although it's not a huge part of my total revenue picture.
Well, I think that's enough for one day. I hope you found this interesting. This week I'll try to talk a little more about why scripted vendors suck and why I kinda wish I'd never gotten started with them.
In this one I split it up by the line of products. "F" is for furniture, which means cages and stuff like that, and that's in black on the bottom. "A" is for attachments -- the bells and the clothespins -- and that's in dark grey in the middle. "P" means prefabs, which is to say dungeons, and that's in light grey on top. This graph gives you a pretty good idea of my whole business. Most of my revenue comes from the dungeons, but that income is a little feast-or-famine. To even things out a tad I have some other toys, which gives me a little revenue in good times and bad, although it's not a huge part of my total revenue picture.
Well, I think that's enough for one day. I hope you found this interesting. This week I'll try to talk a little more about why scripted vendors suck and why I kinda wish I'd never gotten started with them.
 The focus of this article is a way to get screwed by buying land near hostage land squares.
Hostage land squares work like this. The owner of a plot splits it into two or more parcels. One parcel is large and looks normal. The other parcel(s) are tiny, usually the minimum 16m2. Sometimes these squares will be along the side or seperated somewhat, but often they are embedded right in the middle of the plot. The hapless land buyer buys the main plot, not noticing or appreciating the significance of the little missing squares. After you've committed the buy, something strange happens. For sale signs go up right next to or even inside your property. Now this ugly rotating thing is making a nuisance of itself right in the middle of your new land. The catch is, to get rid of it, you have to buy it. And, surprise, it's extremely expensive:
The focus of this article is a way to get screwed by buying land near hostage land squares.
Hostage land squares work like this. The owner of a plot splits it into two or more parcels. One parcel is large and looks normal. The other parcel(s) are tiny, usually the minimum 16m2. Sometimes these squares will be along the side or seperated somewhat, but often they are embedded right in the middle of the plot. The hapless land buyer buys the main plot, not noticing or appreciating the significance of the little missing squares. After you've committed the buy, something strange happens. For sale signs go up right next to or even inside your property. Now this ugly rotating thing is making a nuisance of itself right in the middle of your new land. The catch is, to get rid of it, you have to buy it. And, surprise, it's extremely expensive:
 That's the essence of this scam: you have to pay far more than that little square is worth in order to get rid of the annoyance of having the giant rotating sign there. In this case the seller is especially annoying, more or less owning up to what they're doing in their profile:
[coming soon]
Sometimes whole crops of these things spring up:
That's the essence of this scam: you have to pay far more than that little square is worth in order to get rid of the annoyance of having the giant rotating sign there. In this case the seller is especially annoying, more or less owning up to what they're doing in their profile:
[coming soon]
Sometimes whole crops of these things spring up:
 This basically destroys the value of any real land in that sim (which is a reason that LL might think about regulating this practice, perhaps by increasing the minimum saleable area, or making it expensive to hold a large number of small parcels, with some kind of extra tier fee). Sometimes these spots are billed as "advertising space", like buying a billboard, but this type of advertisement isn't cost-effective in SL.
The best way to protect yourself is to not get involved with land like this. Use alt-control-shift-P to make sure that the parcel you're buying isn't embedded with 16m2 landmines, waiting to hold you hostage.
This basically destroys the value of any real land in that sim (which is a reason that LL might think about regulating this practice, perhaps by increasing the minimum saleable area, or making it expensive to hold a large number of small parcels, with some kind of extra tier fee). Sometimes these spots are billed as "advertising space", like buying a billboard, but this type of advertisement isn't cost-effective in SL.
The best way to protect yourself is to not get involved with land like this. Use alt-control-shift-P to make sure that the parcel you're buying isn't embedded with 16m2 landmines, waiting to hold you hostage.


